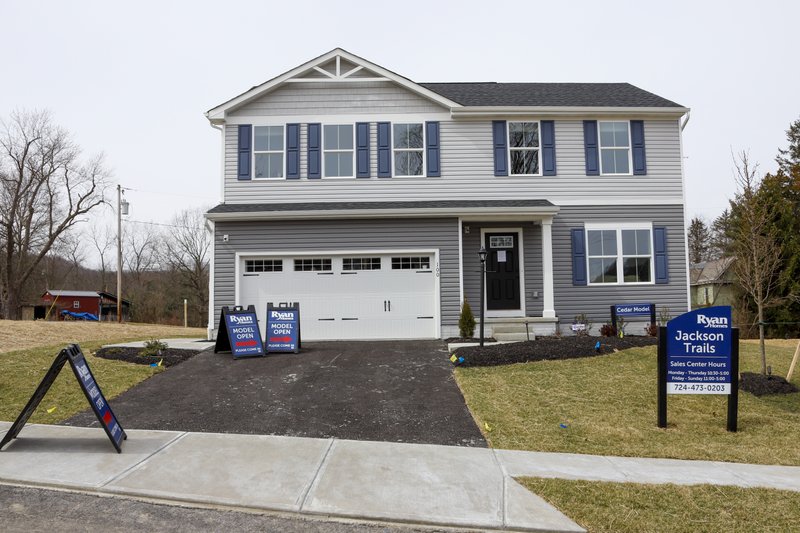
U.S. home prices grew more slowly in May, but continued to show resilience in the face of the coronavirus outbreak.
The S&P CoreLogic Case-Shiller 20-city home price index rose 3.7% in from a year earlier. That’s a drop from the 3.9% increase in April and it was a smaller gain than economists had expected. Still, home prices have risen steadily despite the pandemic and lockdowns that have badly damaged the American economy.
Phoenix led the way with a 9% annual gain in home prices, followed by Seattle (up 6.8%) and Tampa (up 6%). Chicago registered the smallest increase: 1.3%.
The May slowdown, however, broke a streak in rising sales that stretched back to September. Craig Lazzara of S&P Dow Jones Indices said it was too soon to know if April was a high water mark, or if May was “a slight deviation from an otherwise intact trend.″
The National Association of Realtors reported last week that sales of existing U.S. homes shot up 20.7% last month, snapping a three-month streak of falling sales. Mortgage rates are near historic lows.
“In a remarkable show of resilience, the housing market has stared the pandemic right in the eye and hasn’t blinked,” said Matthew Speakman, economist at the real estate firm Zillow. “Record-low mortgage rates and a shortage of available homes have fueled competition amongst buyers in the spring and early summer, leading to homes flying off the market at their fastest pace in years and home prices to continue to rise.″
The 20-city index released Tuesday excluded prices from the Detroit metropolitan area index because of delays at the recording office in Wayne County, which includes Detroit.
The Case-Shiller index is composed of a three-month average of home prices, so this month’s data includes figures from March, April and May.
(AP)


